|
Austria | Europe
| Global

Austria:

Fig.1: Development of Greenhouse Gas Emissions
in Autstria 1990-2005 (© Umweltbundesamt 2007)
Rückgang
der Treibhausgasemissionen: 11 Mio. Tonnen bis zum Kyoto-Ziel
15.01.2008, © Umweltbundesamt
Auf Basis der Ergebnisse der jährlichen österreichischen
Luftschadstoffinventur verzeichnet das Umweltbundesamt
im Jahr 2006 einen Rückgang der Treibhausgasemissionen: Die
Gesamtmenge liegt im Jahr 2006 bei 91,1 Mio. Tonnen Kohlendioxid-Äquivalenten.
Dies entspricht einer Emissionsreduktion von 2,2 Mio Tonnen oder
2,3% gegenüber 2005.
Aktueller
Trend der Treibhausgas-Emissionen in Österreich
© Umweltbundesamt
Der aktuelle Bericht "AustriaŽs
Annual Greenhouse Gas Inventory 1990-2005" präsentiert
die neuesten Inventur-Daten zu den Treibhausgasemissionen in Österreich.
Er folgt in Form und Inhalt den verbindlichen Anforderungen des
THG-Überwachungssystems 280/2004/EG der EU zur Umsetzung des
Kyoto-Protokolls, und wurde am 15. Jänner an die Europäische
Kommission übermittelt.
Darin wird festgehalten, dass die Gesamtmenge
an Treibhausgasemissionen im Jahr 2005 bei 93,2 Millionen Tonnen
CO2-Äquivalente liegt. Dies entspricht einer Steigerung um
2,1 Millionen bzw. 2,3% gegenüber dem Vorjahr und einem Anstieg
von 18,1% gegenüber dem Kyoto-Basisjahr 1990.
TOP

Europe:
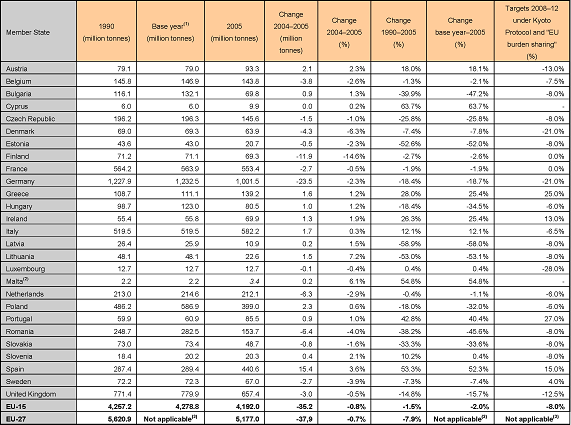
Table 1: Greenhouse gas emissions in CO2 equivalents
(excluding carbon sinks) and Kyoto Protocol targets for 2008–12
(© EEA 2007)

(1) For EU-15 the base year for CO2, CH4 and N2O is
1990; for the fluorinated gases 12 Member States have selected 1995
as the base year, whereas Austria, France and
Italy have chosen 1990. As the EU-15 inventory is the sum of Member
States' inventories, the EU-15 base year estimates for fluorinated
gas emissions are the sum of 1995
emissions for 12 Member States and 1990 emissions for Austria, France
and Italy. The EU-15 base year emissions also include emissions
from deforestation for the
Netherlands, Portugal and the UK (‘The European Community's
initial report under the Kyoto Protocol' (EEA, 2006)).
(2) Malta did not provide GHG emission estimates for 2005, therefore
the data provided in this table is based on gap filling (see Chapter
1.8.2.).
(3) EU-27 does not have a common Kyoto Protocol target
Note: Malta and Cyprus do not have individual Kyoto targets.
EU
greenhouse gas emissions decrease in 2005
© EEA 2006
Emissions of climate-changing greenhouse gases (GHG) decreased between
2004 and 2005, according to the annual GHG inventory report of the
European Community prepared by the European Environment Agency (EEA),
in Copenhagen. The report, 'Annual European Community Greenhouse
gas inventory 1990-2005 and inventory report 2007', was submitted
to the secretariat of the United Nations Framework Convention on
Climate Change (UNFCCC) as the European Community's official submission.
The EEA released the main, preliminary, messages of the report in
May 2007 because of public and political interest in the issue of
climate change. The final version of this report was submitted to
the UNFCCC on 27 May 2007.
EU
greenhouse gas emissions increase for second year in a row
Emissions of climate-changing greenhouse gases
(GHG) from the EU-25 increased by 18 million tonnes (0.4 %) between
2003 and 2004. Emissions from the EU-15 increased by 11.5 million
tonnes (0.3 %) in the same period. These figures, released today,
are contained in the latest GHG inventory report from the European
Environment Agency (EEA), based in Copenhagen.
© EEA 2006
Greenhouse
gas emission trends and projections 2005
Projections show that the pre-2004 EU Member States
(EU-15) could cut their total emissions to 9.3% below 1990 levels
by 2010 with a combination of existing domestic policies and measures
already implemented, additional policies and measures currently
being planned and the use of credits from emissions-saving projects
in third countries through the Kyoto Protocol's "flexible mechanisms".
Thus the EU-15 Kyoto Protocol target could be achieved.
© EEA 2005
TOP

Global:

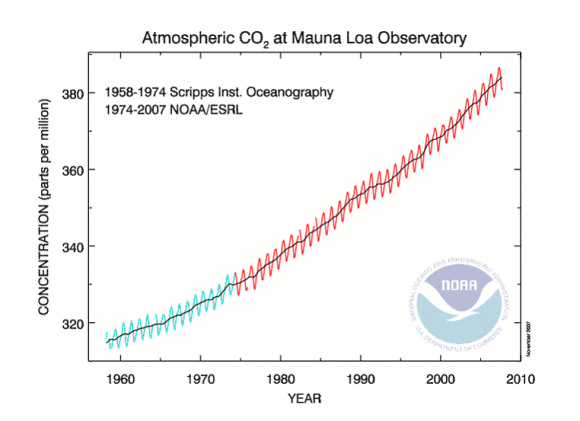
The graph shows monthly mean carbon dioxide measured
at Mauna Loa Observatory (Hawai), which has the longest continuous
record of direct atmospheric CO2 measurements (since 1959).
Source: Dr. Pieter Tans, NOAA/ESRL (www.esrl.noaa.gov/gmd/ccgg/trends/)
TOP
20 emitters
Ranking of the world's countries by 2004 total
CO2 emissions from fossil-fuel burning, cement production, and gas
flaring:
| RANK |
Nation |
Carbon emissions (in thousand metric
tons of carbon)
|
Emissions per capita (world wide rank)
|
| 1 |
USA |
1650020
|
5,6 (9)
|
| 2 |
China |
1366554
|
1,1 (92)
|
| 3 |
Russian Federation |
415951
|
2,9 (28)
|
| 4 |
India |
366301
|
0,3 (129)
|
| 5 |
Japan |
343117
|
2,7 (33)
|
| 6 |
Germany |
220596
|
2,7 (36)
|
| 7 |
Canada |
174401
|
5,5 (10)
|
| 8 |
United Kingdom |
160179
|
2,7 (37)
|
| 9 |
Republic of Korea |
127007
|
2,6 (39)
|
| 10 |
Italy (incl. San Marino) |
122726
|
2,1 (50)
|
| 11 |
Mexiko |
119473
|
1,1 (84)
|
| 12 |
South Africa |
119203
|
2,7 (34)
|
| 13 |
Islamic Republic of Iran |
118259
|
1,8 (63)
|
| 14 |
Indonesia |
103170
|
0,5 (121)
|
| 15 |
Fance (incl. Monaco) |
101927
|
1,6 (66)
|
| 16 |
Brazil |
90499
|
0,5 (118)
|
| 17 |
Spain |
90145
|
2,1 (52)
|
| 18 |
Ukraine |
90020
|
1,9 (56)
|
| 19 |
Australia |
89125
|
4,4 (13)
|
| 20 |
Saudi Arabia |
84116
|
3,7 (18)
|
| 47 |
Austria |
19051
|
2,3 (46)
|
Source: Gregg Marland, Tom Boden, and Bob Andres;
Oak Ridge National Laboratory.

Source: CDIAC
(Carbon Dioxide Information Analysis Center)
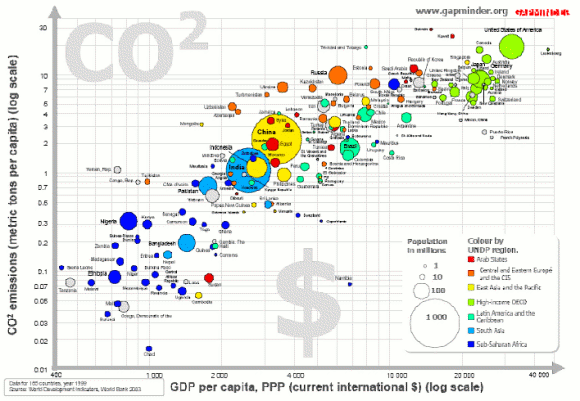
Relationship
between CO2 emissions and GDP per capita

Source: Gapminder.com
UNFCCC:
Emissions of industrialized countries rose to all time high in 2005
According to data submitted to the secretariat
of the United Nations Framework Convention on Climate Change (UNFCCC),
the total greenhouse gas emissions of 40 industrialized countries
rose to an all-time high in 2005, continuing the upward trend of
the year before.
20.11.07, © UNFCCC
Rich
nations' greenhouse gases up, despite Kyoto
Industrialised nations' emissions of greenhouse
gases edged up to the highest level in more than a decade in 2004
despite curbs meant to fight global warming, data compiled by Reuters
showed on Thursday.
31.08.06, © Reuters
JAVA Climate Model
Das interaktive JAVA Climate Model erlaubt es,
die Klimazukunft unter selbst zu wählenden Randbedingungen
blitzartig darzustellen.
"Global,
Regional, and National Annual CO2 Emissions From Fossil-Fuel Burning"
A Compendium of Data on Global Change, ©
CDIAC
Greenhouse
Gas Inventory Database
© UNFCCC, On-line searchable database of
GHG inventory data (Annex I and non-Annex I Parties)
Greenhouse
Gas Emissions from Annex I Countries
© Grid Arendal (UNEP)
TOP

© ACCC,
2008-11-01
webmaster
|


